"Worst economy ever"? Not even close!
- tim@emorningcoffee.com
- Feb 26
- 6 min read
Updated: Feb 26
Throughout the recent election – and continuing to this day – President Trump has said that former president Biden was in charge of the “worst economy ever”. As most folks know by now, you have to take nearly everything Mr Trump says with a grain of salt. However, for the record, I thought it would be interesting to look at some economic metrics to see how past administrations had performed, so

that you can draw your own conclusions. For the record, all of the data used in the tables in this article were derived from FRED (Federal Reserve Economic Data, St Louis Fed), aside from historical data for the S&P 500 (since FRED data did not go back far enough). I have looked at 11 administrations (seven different presidents) since 1981, starting with former president Reagan’s first administration. The administrations during this period are in the table to the right.
I created eight tables that score each administration, and these tables can be divided into four categories:
Economic growth (1): Real GDP over term of each administration; data is available per quarter, and growth is measured from the first quarter the presiden was in charge to the last.
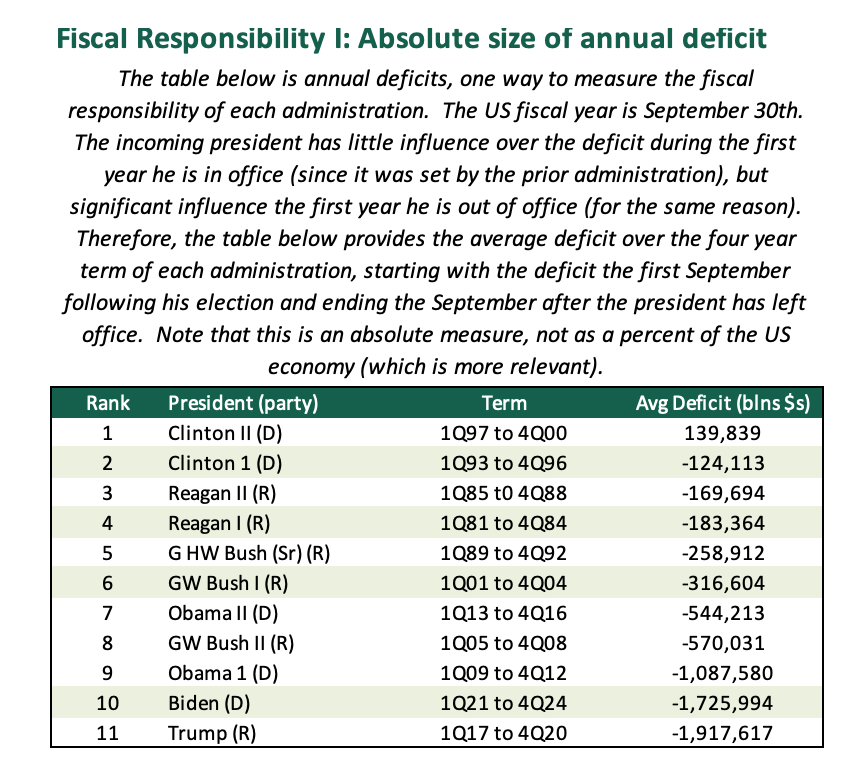
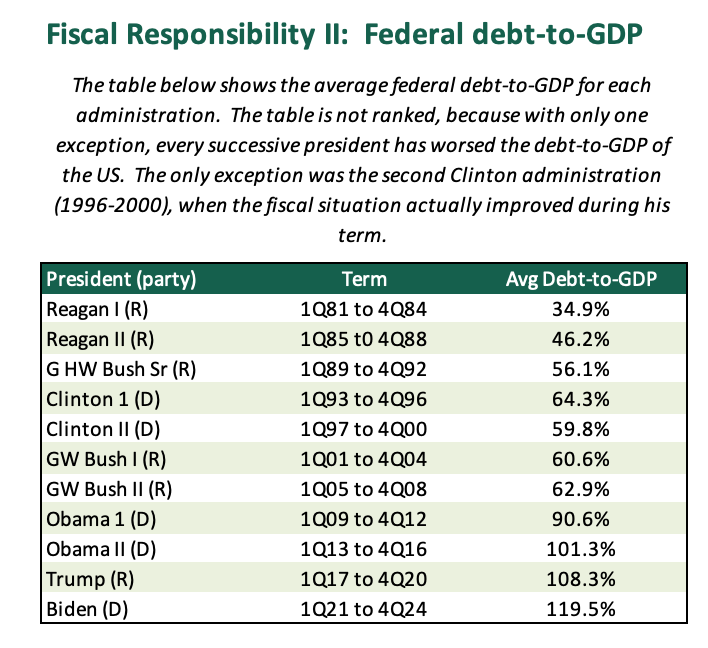
Fiscal responsibility (2): These two tables – the average deficit during the term of the president and the average debt-to-GDP – measure the fiscal responsibility of each administration.
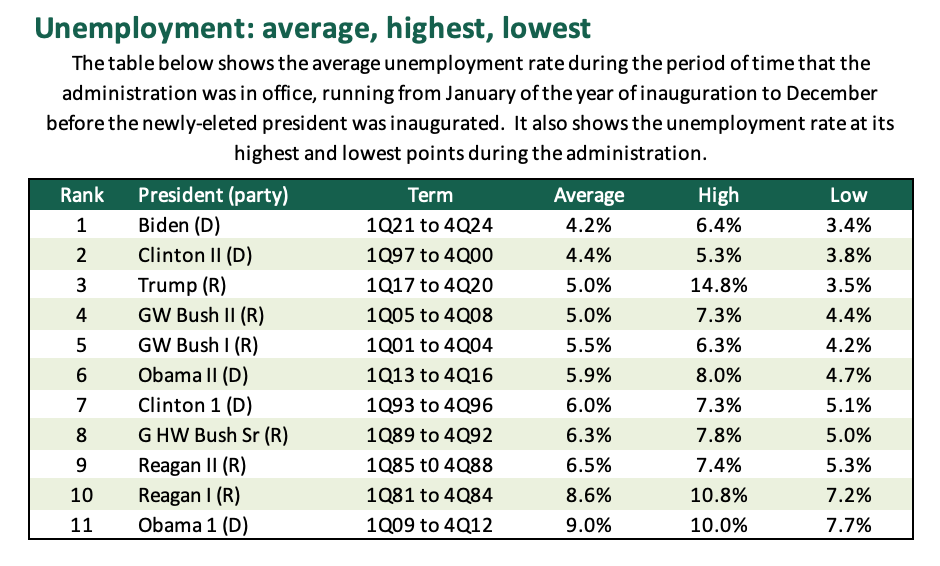
Unemployment and Inflation (2)
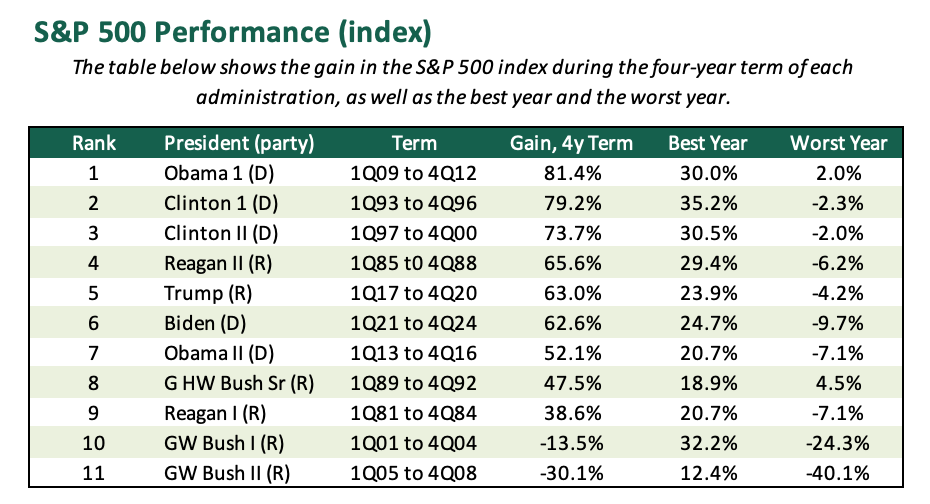
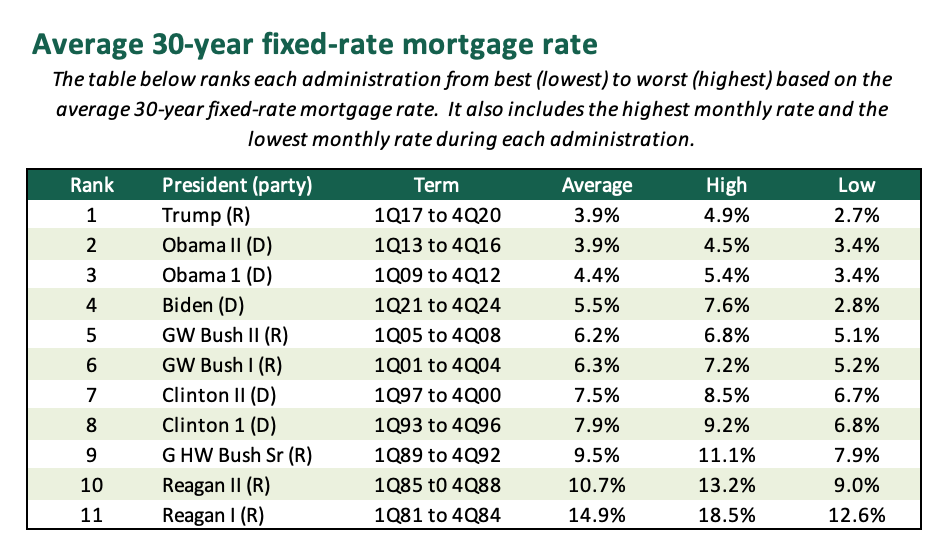
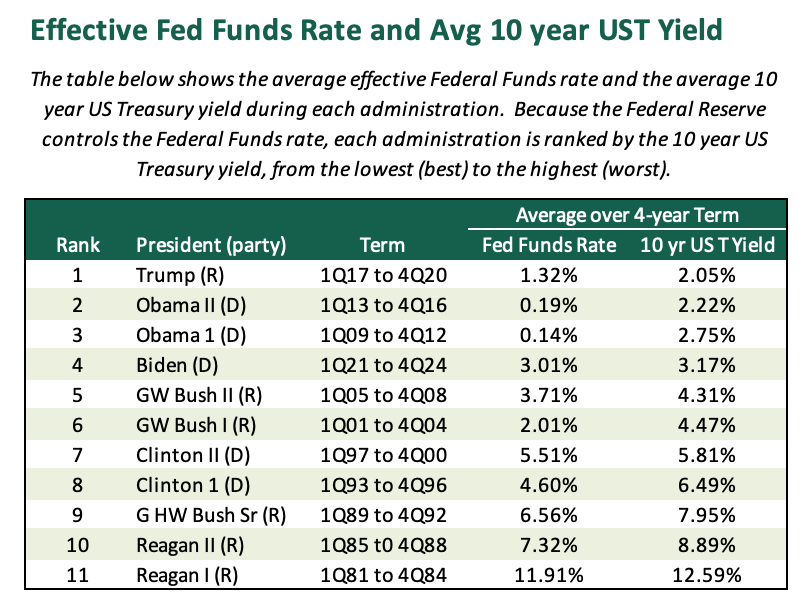
Financial markets (3): The first table measures the improvement in the stock market, measured by the change in the S&P 500, during each administration. The second table measures the average yield on 30y mortgages. The third table provides the average federal funds rate and the 10y US Treasury yield during each administration.
As you are looking at the tables and commentary below, please keep in mind the following three notable events that have been very influential over the last 55 years.
1970s inflation: Inflation was fuelled by a series of oil supply shocks in the 1970s, causing inflation to soar in 1973-74 and again in 1979-1981, peaking in March and April 1980 at 14.6% (CPI YoY). Fortunately, the Federal Reserve under Paul Volker did its job in the late 1970s, increasing the Fed Funds rate sharply. During the first half of 1981, the effective Fed Funds rate was above 19% most likely the highest ever (and certainly the highest since at least 1954 which is how far back data is available on FRED). The extraordinarily restrictive monetary policy had the desired effect of quelling inflation, but at a severe cost to the US economy which experienced a double dip recession, the first one occurring at the beginning of 1980, and the second one in 1981-1982. In essence, former President Reagan entered the Oval Office facing a severe bout of stagflation: inflation was trending down but was still at 11.8% when he was inaugurated, and US economic growth was stagnating as the economy headed towards another recession.
The Great Recession: In late 2007, the U.S. entered its steepest economic downturn since the Great Depression in the 1930s. The causes of the downturn included excessive risk taking (i.e. the Fed was too loose for too long, spurring risk taking), lax regulation, and increased use of leverage, most visible in the CLO, CDO and MBS securitisation markets, all of which essentially collapsed. Ground zero for the recession was in the U.S. but the global economy was also badly affected. The second Bush Administration took numerous steps towards the end of its second term to address the downturn and right the ship, including taking drastic fiscal measures and other steps to restore confidence in the US banking system. The period also ushered in the use of unconventional monetary policy involving quantitative easing alongside effectively 0% interest rates to stimulate growth. Former President Obama was left to pick up the pieces of this downturn, which – as with the period of stagflation in the late 1970s/early 1980s – took several years to remedy.
The pandemic: Mr Trump was President when the first pandemic in over 100 years started to derail the global economy in March 2020. To restore economic growth after the economy shut down in mid-March 2020, The Trump Administration passed two large fiscal stimulus plans to guide the US economy back to growth. The Federal Reserve also sprang into action, (re)introducing 0% interest rates and undertaking another round of quantitative easing. 2020 proved to be the worst year for the US economy since 1946, with growth declining 3.5%. President Biden was left to pick up the pieces of a badly damaged US economy in January 2021, passing a third fiscal stimulus relief package in the first months after he assumed the presidency. The three stimulus plans (two under Trump and one under Biden), along with in the Fed providing accommodative monetary policy (for arguably too long), set the stage for a sharp recovery in economic activity which was accompanied by the highest inflation since the early 1980s. Although inflation peaked at 9% in June 2022, it has been brought down sharply since then, reaching 2.9% in December 2024, Mr Biden’s last month in office. Even so, inflation still has not come back to the Fed’s target of 2%. Aside from elevated inflation and his false claims about inheriting a weak economy, President Trump (Trump 2.0) was sworn in in January 2025 during one of the broadest and strongest economic periods in US history.
Of course, other events also shaped the “performance” of various administrations, including
“Black Monday” in October 1987,
the first Gulf War in 1991,
a recession in 1990-1991 caused by a savings & loan crisis,
a series of emerging markets disruptions including the Mexican Peso crisis in late 1994, the Asia crisis in 1997-98, and a default by Russia in 1998,
the failure and government bailout of LTCM in 1998,
the dot.com bust in 2000-2002, which ushered in a recession in 2001,
the 9/11 terrorist attacks in September 2001,
the near meltdown of the Euro in 2012,
the failure of Silicon Valley Bank and other regional banks in March 2023, and
various other “mini crisis” over the last 55 years.
I have provided some commentary on the four category of tables below, keeping in mind the various economic events highlighted above that have affected most administrations in some way. However, with the context above and noting that the tables are based on factual data, nearly all from FRED, the tables show clearly how each administration did across a number of economic metrics.
Economic growth (ranked from best to worst)
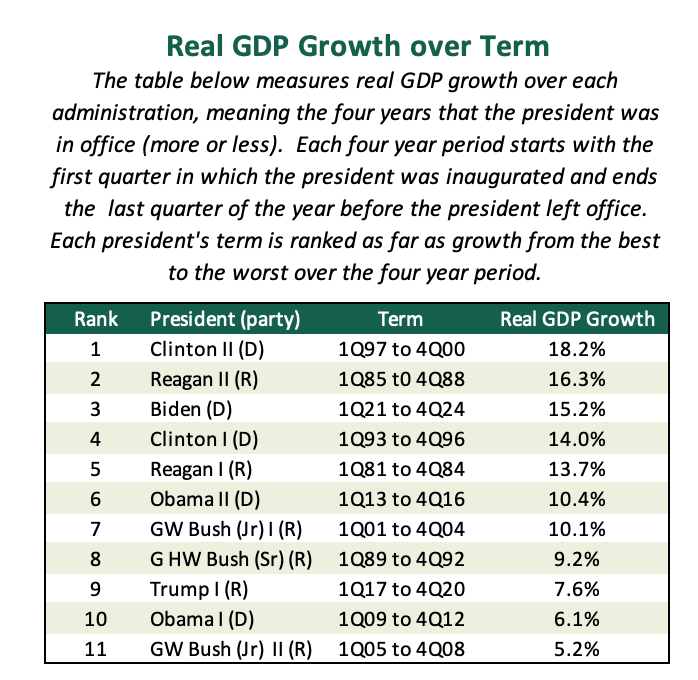
For the record and to counter Mr Trump’s false claims about “the worst economy ever”, Mr Biden’s record as far as economic growth was far better than Mr Trump’s (during Trump 1.0).
Fiscal responsibility
It should not surprise you that the fiscal condition of the US has worsened under nearly every single administration since 1981, when Mr Reagan started his first term. Both tables show that Mr Trump and Mr Biden have been the worst two presidents as far as the fiscal condition of the U.S., so neither has been particularly helpful in this respect. Rather ironically (since he was a Democrat), you will note that the last president to lower the debt-to-GDP in the US and run a budget surplus was former president Clinton during his second term.
Unemployment and inflation
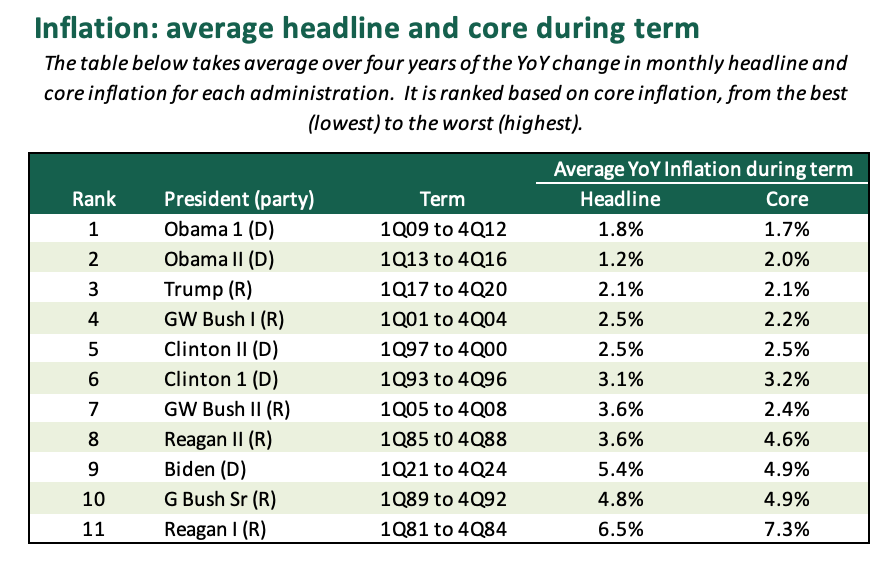
The first table below shows that Mr Biden has the best jobs market of any administration since at least 1981, debunking Mr Trump’s constant claim about the weak U.S. economy. However, the second table shows one of the major reasons Mr. Biden lost the 2024 presidential election, in that Americans suffered from high inflation. Even in this respect however and to debunk Mr Trump’s claims, it was nowhere near the highest inflation ever as you can see in the tables.
Financial markets
These tables look at measures closer to the hearts of consumers, including the performance of stocks during each administration (measured by change in the S&P 500), the average 30-year residential mortgage rate (a measure of housing affordability) during each presidency, and the Fed Funds and 10-year US Treasury yield under each administration. The tables suggest that as far as rates and market yields, Mr Trump did the best of the 11 administrations. However, as far as the performance of stocks, both Mr Trump and Mr Biden were in the middle of the pack, more or less tied.

Comments