


"New Tech" / WFH Companies: Week 4
- tim@emorningcoffee.com

- Feb 22, 2021
- 13 min read
DISCLAIMER: Below are my opinions on six stocks that are reporting earnings the week of Feb 22nd 2021: ABNB, DASH, ETSY, NVDA, SQ and TDOC. I am not a research analyst or a registered investment advisor, and the information in this article is not a recommendation to buy or sell shares. It is just my two cents. I do not currently own shares of any of these companies.
This is the fourth instalment of my look at some “new tech / WFH” companies, consisting of six companies that will be reporting earnings this week: AirBnb (ABNB), DoorDash (DASH), Etsy (ETSY), Nvidia (NVDA), Square (SQ) and TelaDoc (TDOC).
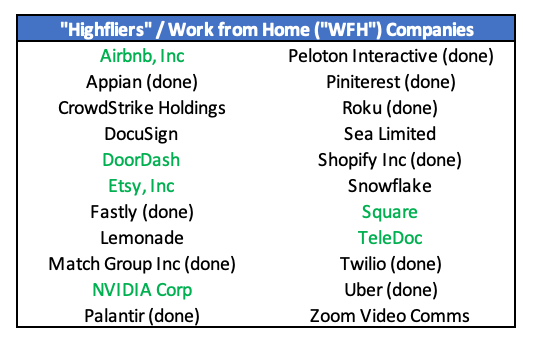
As a reminder, the 22 companies that I will have or will be presenting their results this cycle are listed in the table to the left.
These companies tend to be disrupters and most, but not all, have benefited from the pandemic. Some have been listed only recently, and most are still losing money on the bottom line. Nearly all of the shares of these companies have outperformed the S&P 500 recently. Valuing these companies using traditional valuation metrics is impossible in most cases, so you need to first get your head around what really makes these companies tick. Valuations aside, you might find one or more of these companies attractive should there be a market pullback or if one of these companies stumble (for understandable, short-term reasons) on this round of earnings releases. As these stocks are all particularly vulnerable to substantial downside corrections should overall risk sentiment change (and rest assured that it eventually will), you need to take a long-term view on the attractiveness of each company.
Last week I discussed six other companies: Appian (APPN), Fastly (FSLY), Palantir (PLTR), Roku (ROKU), Shopify (SHOP) and Twilio (TWLO). With the exception of APPN, all of these companies beat their 4Q2020 EPS and revenue expectations; APPN missed its EPS figure but did better than the consensus revenue target. I wrote a brief update on the results of last week’s high flyers which you can find in my blog here: “Results: Week 3 “New Tech” / WFH Companies”.
At the end of this article following the discussion, I have included two tables which have information about each company’s financial results and share performance. Analysts’ consensus sales and earnings for 4Q2020 are included towards the bottom of the second table so that you can track how the companies’ actual results to analysts’ expectations. The table also includes FY2021 projected earnings and revenues for each company. These are critical when listening to and evaluating forward guidance, because they form the foundation of the lofty valuations of these companies.
These companies' stocks returned between 40% and 301% to investors that owned shares for the full year 2020 (for ABNB and DASH calculated using the price of their shares at the close on the first day of trading post-IPO on Dec 9th) and have returned between 14% and 46% year-to-date this year, keeping in mind that the year is only seven weeks old! The valuations are currently rich as we head into earnings, with five of the six companies’ share prices within 10% of their all-time highs
To provide a summary before getting into my more descriptive views, the table below contains headline data for the six high flyers being discussed this week.

Square Inc (NYSE: SQ, investor website here):

Square is probably well-known to most of you, because you increasingly see it being used by small businesses at point-of-sale. SQ is first and foremost a payment app (hardware and software) used by small businesses, but the company offers its customers much more than just electronic payments by including extensive data analytics and reporting. It also has developed a cash transfer app (“Cash App”) to allow users to send, receive and save cash. Within Cash App, SQ permits the transfer of Bitcoin, which has clearly provided tailwinds since BTC’s price has recently been increasing rapidly. Moreover, before Elon Musk grabbed headlines a few weeks back by announcing that TSLA had invested $1.5 bln of excess cash in BTC, Square had already invested a much smaller amount ($50 million, of $2.9 billion) of its own cash in BTC last autumn, clearly supported by it cash app flows in BTC. The founder (in 2009) and CEO of SQ – Jack Dorsey – is also the founder and CEO of Twitter (TWTR, founded in 2006). SQ went public in 2015. As far as its revenues, about three-quarters of SQ’s revenues in 3Q20 came from the small business seller app and the remaining one-quarter came from (peer-to-peer) cash transfers. SQ’s fees for the PoS app range from 1.75% (automatically via chip, etc) to 2.50% (manually entered). For the peer-to-peer cash transfer app, the fee for 2-3 day settled cash transactions is normally nil unless it involves a credit card transfer (3% fee) or an immediate transfer (1.5%). Hardware sales (e.g. the Square PoS module) generally account for less than 2% of revenues. Top-line revenues can (and will be) materially affected by the change in price of BTC, so be aware of this as you look at the numbers. For example, in 3Q20, over 50% of revenues ($1.6 bln of $3.0 bln total revs) were attributable to BTC transfers, but only 4% of gross profits came from transfers of BTC. I haven’t complete figured out the accounting, but the company’s 10-Q provides enough segment data that the gyrations in the price of BTC should be clear. SQ was materially and negatively affected by the pandemic because many of its small business users shuddered their businesses in late March and April (2020). SQ also took proceeds under the PPP portion of the CARES Act, as (I think that) the company extends credit to its customers which also caused some difficulties. However, as economies reopened, the company then realised rapid improvement in its operating performance. The macro longer-term trend favouring SQ is the migration of the world towards a cashless economy in any event, pandemic-aside. In fact, reflecting its rapid recovery as things slowly normalised, SQ was bottom-line profitable in the 3Q2020. The company ended the quarter with $2.9 bln of cash on hand. SQ’s major competitor as far as the peer-to-peer cash transfer app is Venmo, which is owned by PayPal. Motley Fool generally is bullish on SQ but reminds its followers quite rightly that the top line can be volatile because of fluctuations in the price of BTC. It is not currently on the MF Top 10 list. The StarMine (Refinitiv) consensus analysts’ rating for SQ is 6.2 (neutral). SQ has beat its EPS targets the last two quarters (2Q and 3Q) by substantial margins. Remember – focus on user data segmentation and gross profits (ex-BTC), and on EPS more than top-line revenues!
Teladoc (NYSE: TDOC, investor website here):
Teladoc is a virtual healthcare company which provides telephone and videoconferencing capabilities for patients seeking digital consultations with physicians. TDOC was founded in 2002 and went public in 2015. The company has traditionally been acquisitive as it has sought to consolidate on-line medical platforms and expand its product scope, most recently merging with Livongo Health (app principally focused on tracking diabetes) in 3Q20 in a transaction valued at $18.5 bln. TDOC is a B2B focused company, working with insurance companies, employers, and hospitals and health systems. Obviously, the pandemic was a big positive for TDOC as more and more people opted to consult doctors virtually rather than go to doctors’ offices or to hospitals. When the pandemic ends, this behaviour might change for some, but I believe for a variety of reasons that telemedicine is here to stay and is poised for further growth. The risks for TDOC are that the company is acquisitive, it spends a lot on customer acquisition / market share growth, and it must constantly spend to invest in technology. The company is not profitable, and I presume it never has been. At the end of September, TDOC had $1.2 bln of cash on its balance sheet. It is the smallest of the companies I am presenting this week as far as revenues (less than $1 bln LFQ) and the second smallest by market cap ($42 bln). However, TDOC has had the best YtD return (+46.3%) of all six, perhaps implying it is the fullest valued. The company missed analysts’ consensus expectations that last three quarters. Motley Fool seems to like the company but implies that the stock has gotten expensive (true). The StarMine (Refinitiv) consensus rating for TDOC is 3.0 (bearish).
Nvidia (Nasdaq: NVDA, investor website here):

Of the six companies I am writing about this week, NVDA is head and shoulders above the other five in terms of its history, size, profitability, success and overall scope of business. NVDA is a designer of graphics processing units (GPUs) most well-known perhaps for use in gaming. Its chips are also used by the automotive industry and for mobile computing, and the company is increasingly involved in artificial intelligence. NVDA also provides processors for cryptocurrency mining. Its competitors include AMD, Intel and Qualcomm. The company was founded in 1993 and went public in 1999. Nvidia has historically been operationally successful and fast growing, although like some of the other companies on the high flyer list, the pandemic pushed its business forward faster because of the growth in gaming propelled by stay-at-homers. NVDA’s chips are also widely used in data centres. For the last four quarters, the company had nearly $16 bln of revenues, $6.9 bln of adjusted EBITDA and $3.8 bln of net income. Nvidia had $10.2 bln of cash on its balance sheet at the end of September, and the company is rated A2/A-, affording it very favourable borrowing costs in the capital markets. The StarMine consensus analysts’ rating is 0.9 (very bearish) reflecting the rapid increase in stock price and rich valuation compared to peers like INTC, AMD, TXN and QCOM. In contrast, Motley Fool – which cares much more about the company and its growth prospects than valuation – has NVDA in its Top 10 list now, and this is not the first time. The company pays a small dividend and has beat consensus earnings the last three quarters. NVDA is huge, with a $376 bln market cap. From a market position, I believe that NVDA is one of the best companies to own that I am presenting this week, but the fact is that the stock has skyrocketed and is expensive at these levels. Comparing NVDA to sector peers, the market value of equity for the company is around 22x expected 2021 revenues, compared to AMD at 8x, QCOM at 5.3x, INTC at 3.5x, and TXN at 9.9x. There is also the ongoing issue of shortages of semiconductors which could affect Nvidia and its chip-manufacturing peers in the coming quarters, most likely by pushing up prices (and hence revenues and valuations).
Etsy (Nasdaq: ETSY, investor website here):

Etsy is a global online marketplace focused on vintage items, homemade goods, arts and crafts. The company was founded in 2005 and went public in 2015. At Sept 30th 2020, the company had 69.6m active buyers and 3.7m active sellers (source: Etsy website). The company operates around the world but focuses on six key countries: US, UK, Canada, Germany, Australia and France. Etsy has an excellent presentation about the company on their website (PPT, 44 pages), and you can find it here. The company books revenues principally from transaction and listing fees (76% of revenues in 3Q20), with the remainder (24%) coming from service fees which include on-site advertising, shipping label/protection and other value-added services. Different from AMZN, WMT and other larger and more mass market focused e-commerce firms, ETSY tilts towards more active engagement with sellers and offers more unique, valued-added products, affording higher commissions and transaction costs. Transaction and listing fees for things sold on the ETSY site range from between 3% and 5% plus a flat fee. ETSY has also been busy as far as M&A, having closed on the acquisition of Reverb – a re-seller of new, used and vintage musical instruments in August 2019 for $275m cash. ETSY was added to the S&P 500 index in September 2020. I know little about this company aside from the materials I quickly reviewed but have been able to draw some conclusions. Firstly, ETSY was clearly a pandemic beneficiary, both because people moved to on-line shopping/e-commerce and because ETSY sold (and continues to sell) a meaningful number of masks. Revenues nearly doubled in 2Q20 vs 1Q20, and EBITDA nearly tripled, so the positive effects are clear. Masks accounted for over 20% of gross merchandise sales (GMS) in 2Q20, but this percentage steadily declined in the subsequent three months (July-September). The composition of mask sales will be a focal point for 4Q20 earnings. Secondly, ETSY is not capital intensive and is EBITDA positive and has been for some time. As such, much of the positive EBITDA drops down to the bottom line and translates into very robust positive cash flow. The company had over $1.5 bln of cash and liquid investments on its balance sheet at the end of 3Q20. Thirdly, although the company does not pay a dividend, it has been returning capital to shareholders by repurchasing shares. The company reported that it had repurchased $222.5m of shares (average cost $33.78) since 4Q17. StarMine analysts’ consensus views rate ETSY 6.9 (neutral), and while not currently a top 10 pick of Motley Fool, it has been in the past and MF is positive on the company. ETSY missed 1Q20 analysts’ consensus earnings but beat 2Q and 3Q. I consider this quarter pivotal for ETSY because 3Q20 vs 2Q20 was not particularly inspirational as far as growth and there was noise from mask sales. The valuation is of course over-done like everything else at the moment, but I do like the company’s asset-light balance sheet, the fact that it is bottom-line profitable and generates substantial positive free cash flow, and the large market opportunity. This is one worth looking at closely.
Airbnb Inc (Nasdaq: ABNB, investor website here):

Following their successful IPOs in early December, I wrote about ABNB and DASH in a blogpost dated December 15th that you can find here. ABNB listed its shares on December 9th at $68/share, and the shares closed the first day of trading at $189.51/share, not bad for those preferential investors that got in at the IPO price. Since then, the share price settled and drifted down, but then shot back up, returning 37% YtD for investors that owned shares at the close of the year on December 31st. Airbnb’s business needs no explanation really, as it is a well-known disrupter in the travel industry. However, unlike many others on this list that benefitted from the pandemic, ABNB suffered enormously as a result of the virus and is yet to fully recover. This could take many more quarters in fact but is clearly correlated positively with the demise of the pandemic. Even so, the company’s disruptive model is recognised as playing perfectly into the “rent don’t own” philosophy that has gripped Millennials and Gen Z. ABNB believes it has just scratched the surface of the market potential of home / room sharing, and this is the foundation of the long game for the stock. The company has taken appropriate steps to comply with the more strict requirements in most countries regarding cleanliness and so on because of the pandemic. ABNB is an obvious recovery trade, with the company’s operating results expected to boom as the pandemic subsides and people resume travelling. The company’s gross bookings and revenues in 2Q20 fell to around one-third of those in 4Q19 (pre-pandemic), but subsequently nearly quadrupled in 3Q20 (compared to 2Q20), illustrating the resurgence in travelling and pent-up demand to go on holiday as the first wave of the pandemic subsided during the summer. Even better, the company was surprisingly profitable on the bottom line in 3Q20, rather materially in fact. ABNB has a strong balance sheet, with nearly $6.3 bln of cash on hand at the end of 3Q20 (pro forma for the IPO). Its short history as a public company means that there is not a lot of analysts covering the stock, and in any event, it would not be easy to put a “buy” rating on a company like this that is so richly valued – the company’s current market value of equity of $120 bln is slightly more than Bookings.com (BOOK, $94 bln) and Expedia (EXPE, $23 bln) combined! And the company’s market value is multiples more than traditional hotel chains like Marriott (MAR, $44.2 bln) and Hyatt Hotels (H, $8.3 bln). Of the six stocks I am presenting this week, ABNB is the most heavily shorted. Perhaps not surprising, Motley Fool added ABNB to its Top 10 list for January, which in retrospect looks well-timed. As a recovery play and a play to tap into the long-term macros trend of “rent not buy” theme, ABNB is worth owning but you have to think hard about if you want to own the stock at this super-rich valuation or would prefer to play the “travel recovery theme” through a less-expensive on-line travel agency or traditional hotel stock, of which there are plenty. Certainly, ABNB is one to monitor for weakness and to pounce on if the shares eventually settle. For me, the 4Q is a tough call given the reset of the pandemic, so more importantly will be the outlook and forward guidance provided by the company for FY2021.
DoorDash (NYSE: DASH, investor website here):

As I mentioned in the section above on ABNB, I covered DASH post-IPO in my December 15th article (here). Similar to ABNB, the IPO of DASH was a huge success, especially for investors that got in at the IPO price of $68/share as the stock closed at $144.71 on its first full day of trading. UBER’s results (segment Uber Eats) two weeks ago provided a nice preview of what to expect as far as 4Q20 revenues and earnings for DASH, with perhaps even more optimistic views prevailing since DASH is principally a US food delivery company with dominant market share, estimated at 50%. DoorDash, like all food delivery companies, ended up being a huge beneficiary of the pandemic at least as far as top-line growth, as restaurants and bars closed their doors to inside (and often outside) dining. The question around DASH is simple – will this new reliance on in-home dining via delivery persist as restaurants, bars and pubs reopen? Personally, I believe some might stick, but not a lot because I think people will use the money they have put aside during the pandemic when they could not go out to hit restaurants and pubs hard. In addition, as winter turns to spring and then summer, outside dining will most certainly revive in colder parts of the US, and in-house delivery will wane. The industry is also competitive with low to medium barriers to entry. For comparison purposes, you should known that Uber Eats (UBER provides segment data, released earnings two weeks ago) in the 4Q2020 had $10.1bln of delivery orders resulting in revenues of $1.4bln (+13.5% vs 3Q20) and an EBITDA loss of $145m (vs loss of $183m in 3Q20). Similar to ABNB, DASH is too newly public to have sufficient analysts’ views for StarMine to say anything. Motley Fool does not recommend DASH stock at this price level, and in fact, this is about as close to negative as you will see this investment / media company be. The valuation multiples are mid-tier I suppose compared to others I am presenting this week, but I believe the multiple should be much lower because the operating performance of DASH that we saw in 3Q20 and might see in 4Q20 as the pandemic surged again, is unlikely to persist through 2021. I am not positive on DASH.
Summary of companies presented this week: The first table below contains principally operating results (generally LFQ through Sept 30th 2020, except for NVDA which is LFQ through Oct 25th 2020) for the six companies I discussed above, and the second table contains mainly stock data for these companies. Consensus earnings and revenue expectations for announcements this week are at the bottom of the second table.


The six “new tech” / high flyers I wrote about in this post last week (week 4, earnings released week of Feb 22nd) have now released their earnings. The results and some of the company metrics are in the table below.
For context, let me begin with a quick update since five of the six stocks fell in value last week, and three fell more than 15% W-o-W. Last week was characterised by severe volatility in the equity markets as US Treasury yields spiked, leading to a harsh sell-off in many technology names. The selling was broad and felt largely indiscriminate, but the relative difference in performances of these six stocks following their earnings releases felt about right to m…